A Queue Model of an Emergency Department, to Size an Intervention
TLDR:
- I had assumed a treatment effect in an earlier decision analysis, and could not say whether the number was modest or absurd.
- I read how emergency departments are usually simulated, then built a discrete-event model of a boarding queue and tuned it until its morning trolley count tracked one real hospital.
- Found that the queue is the overflow from a small shortfall in beds, which makes every intervention I tested larger than the problem it is aimed at.
- The executed notebook, the model code and the figures are on GitHub.
Earlier this month I added a decision analysis to my trolley forecast. The weakest part of it was the treatment effect. I had assumed a patient flow intervention would cut the growth in pressure by 15 of 100, and the whole recommendation depended on that number. A forecast cannot say whether the number is plausible, so I built a model of the process that produces the trolley count.
Discrete-event simulation is the standard tool for this. I followed the Little Book of DES, a free guide to building health service simulations in SimPy, for the model structure: patients arrive at a time varying rate, compete for resources, and the model runs through a warm-up period before anything is recorded.
The model is written in SimPy. Patients arrive on a Poisson process whose rate varies by hour and by day of week, wait for an assessment space, and a share of them are admitted. Admitted patients join a first in, first out queue for an inpatient bed. The length of that queue at 8 am is the trolley count, that is the number of admitted patients waiting on trolleys, or gurneys, for a bed. Beds are released in discharge windows that cluster in the late morning and thin out at the weekend, which is why the queue is longest first thing and shortest on a Saturday.
I calibrated it to University Hospital Limerick, which has a complete daily record since January 2023 and the largest counts in the series. Two inputs came from data. The bed count is in my own supplementary data: 553 open inpatient beds in 2025. The daily report also records surge capacity in use, the extra spaces a hospital opens under pressure, and at this hospital that rises with the trolley count. I fitted that relationship and used it as the model's escalation rule. Without it the ward runs at full occupancy, the queue has no stable average, and the simulated count drifts for months at a time.
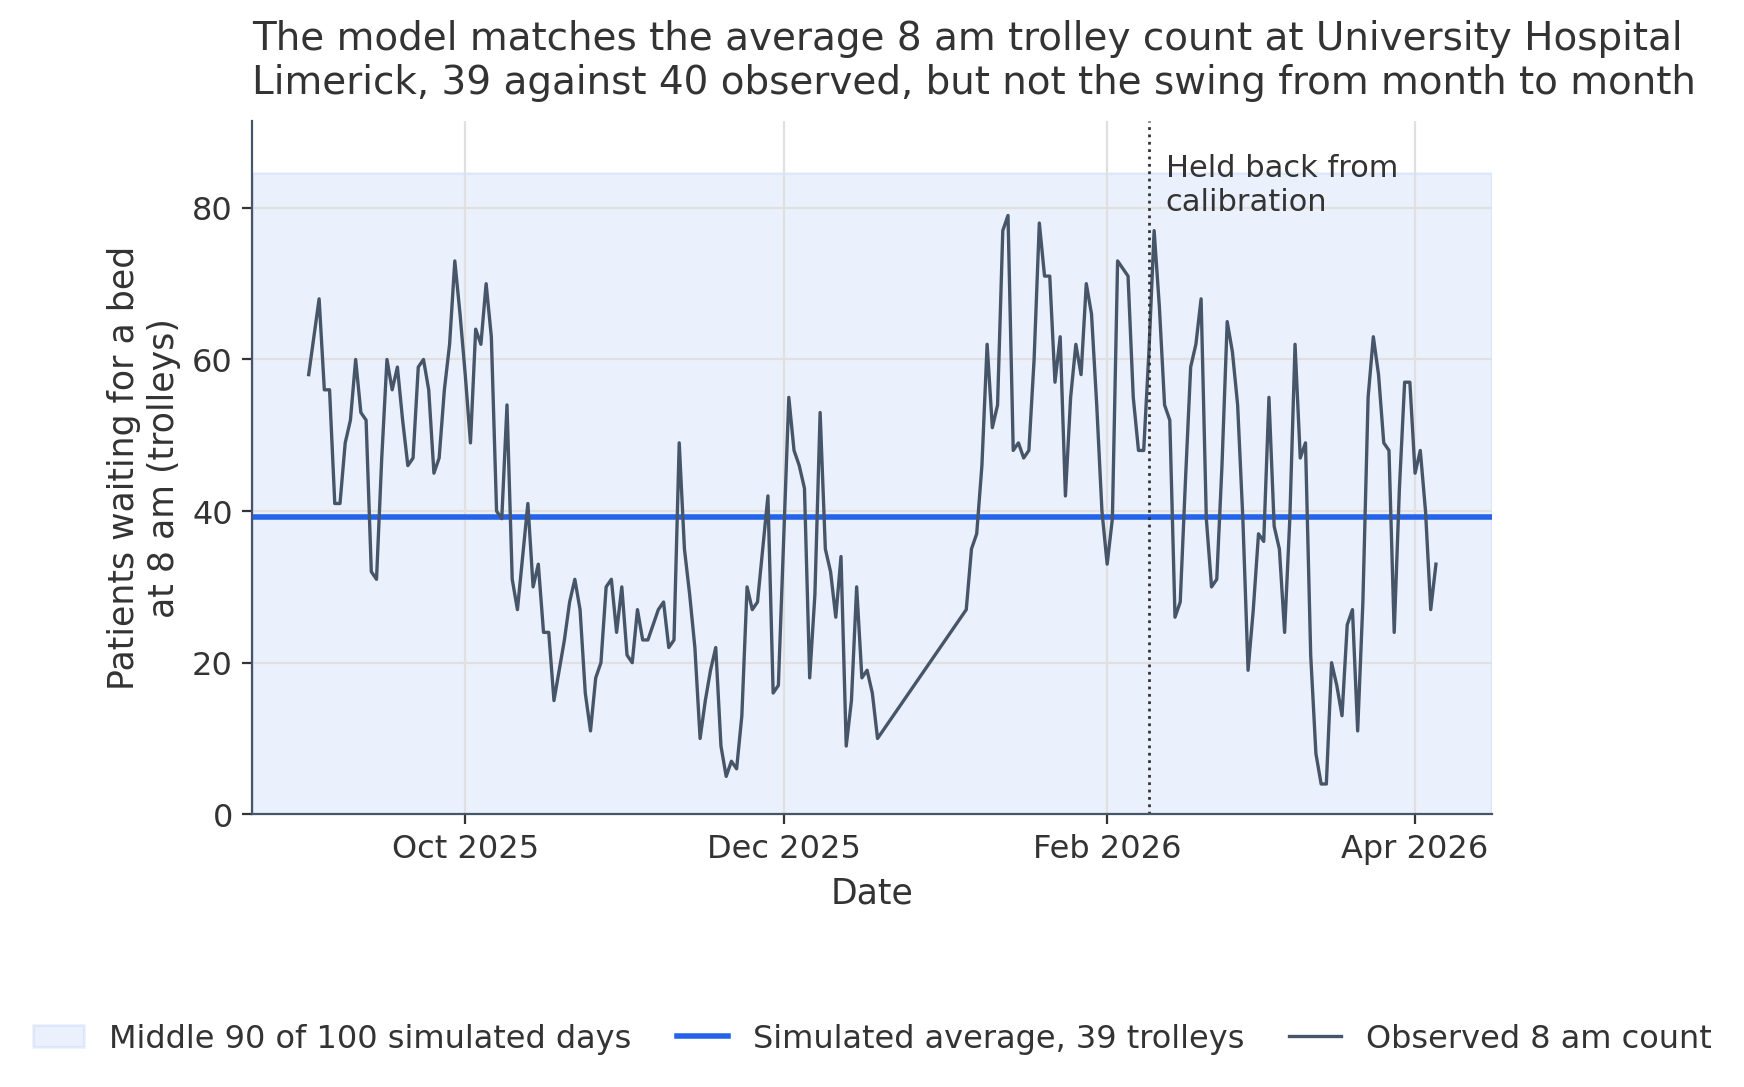
Everything else is assumed and tuned: the arrival rate, the share admitted, the average stay. I searched a grid of 108 combinations, scoring each on how closely its day of week averages matched the real ones. The best set reproduces the window average, 39 trolleys against 40 observed, and on the eight weeks I held back it is wrong by 12.7 trolleys on an average day. In the plot above the simulated average is the flat blue line. What it misses is the swing from month to month, from about 22 trolleys in November 2025 to about 56 in January 2026.
The grid also shows the limit of the method. Ten of the 108 combinations fit within 1 trolley per day of the best one, because a single observed count cannot separate the arrival rate from the admission share from the length of stay. What it does identify is the gap between the bed days emergency admissions demand and the beds available to meet them. Every well fitting combination is between 2 and 14 beds short.
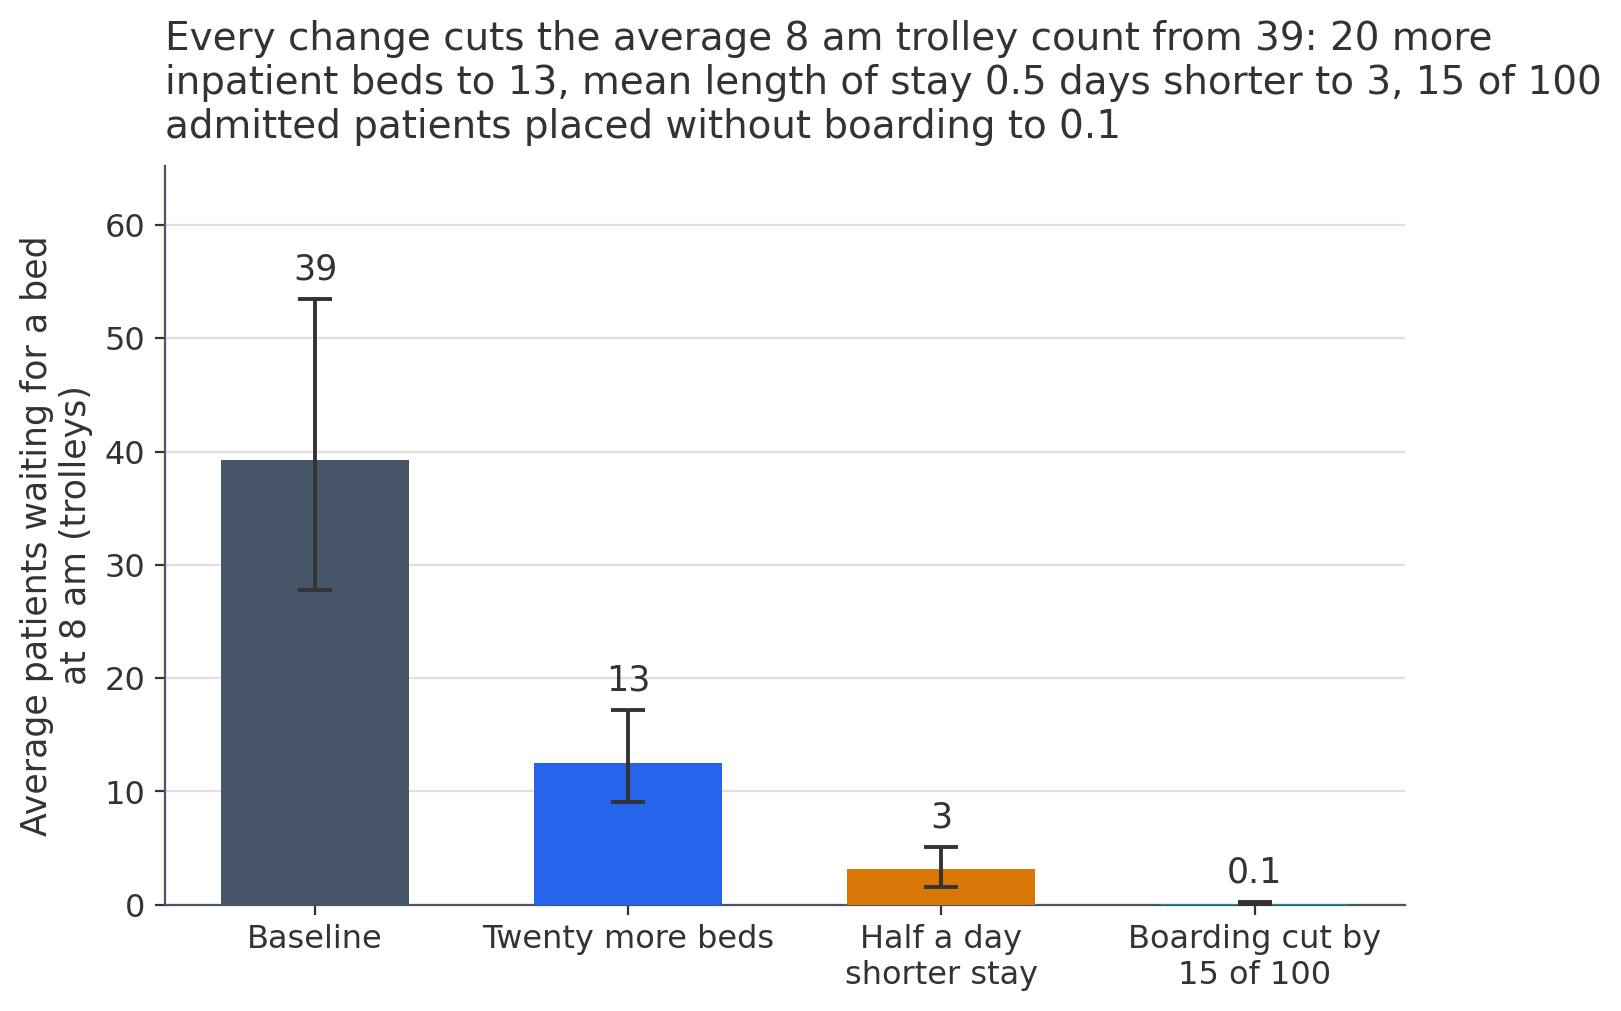
Then the three scenarios, each run 60 times with different seeds. Opening 20 more beds takes the average morning count from 39 trolleys to 13, with a likely range of 9 to 17. Half a day off the average stay brings it to 3, likely range 2 to 5. Removing 15 of 100 admitted patients from the queue, the effect I assumed in the decision analysis, brings it to roughly zero. The high days also disappear. The hospital went above 56 trolleys on one day in four over the window. In the scenarios that falls to 2 days in 100 or fewer.
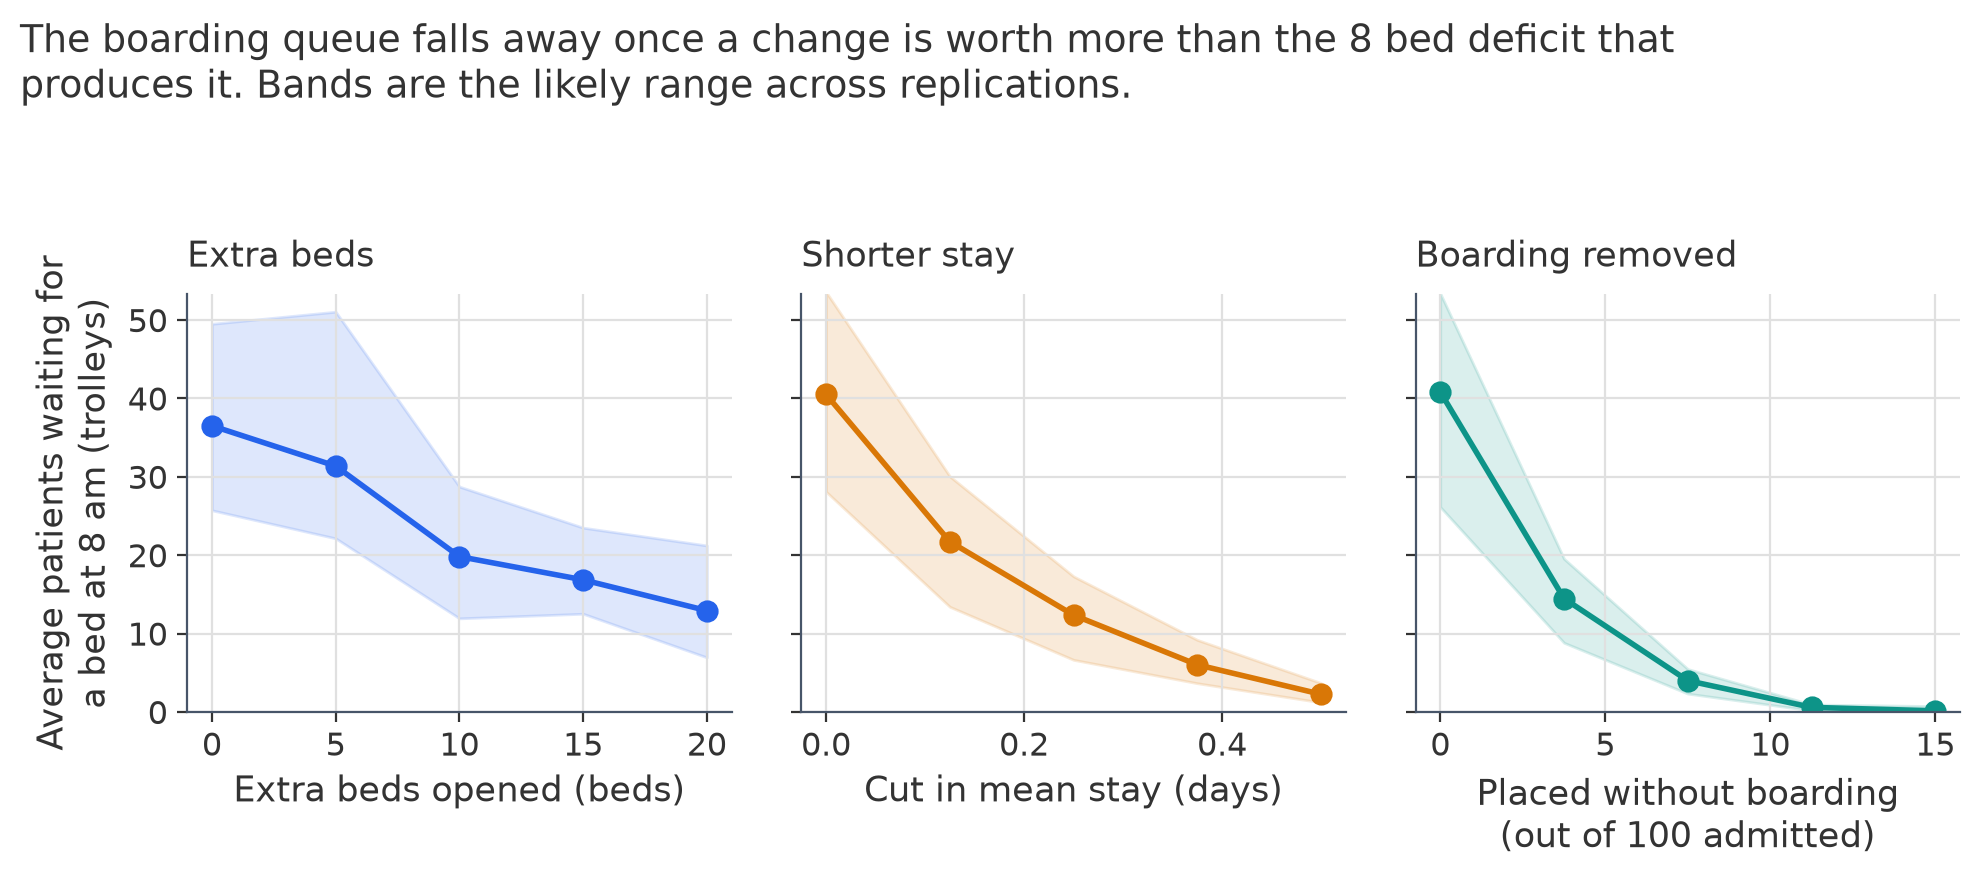
The panels above vary one lever at a time, and in each the curve is steep at the left and flat at the right. That is the answer I wanted, and it shows that my assumption was too large. Half a day off a six day stay frees about as many bed days as 39 beds, and removing 15 of 100 admissions frees about as many as 70. Against a shortfall of 8 beds all three are far larger than the problem. An intervention that genuinely delivered a 15 of 100 reduction would not cut pressure at this hospital by 15 of 100. It would end boarding. Against a January level baseline, where the shortfall is larger, the ordering held: 20 beds leave 20 trolleys behind rather than 13.
What this is: a demonstration that a queue model fitted to one real series answers a question a forecast cannot, which is how large a change has to be before it moves anything. What it is not: a description of how University Hospital Limerick works, a forecast, or evidence about any intervention. The notebook keeps what was observed apart from what was assumed, so each input can be checked. The executed notebook and the model module are on GitHub.