Learning Decision Analysis on Top of a Hospital Forecast
TLDR:
- I wanted to learn what decision analysis adds to a forecast, so I put a small decision model on top of the trolley forecast from my thesis.
- I read two books on decision analysis and built the smallest version of the idea: one region, one week, one yes or no choice.
- Found that the forecast alone never said what to do. The answer came from three assumptions I had to write down, and the model showed where each one changed it.
- The executed notebook, design notes and figures are on GitHub.
My trolley post ended with a forecast of how many admitted patients would be waiting on trolleys for a hospital bed. A forecast does not tell a manager whether to act on it. This post adds that step. The question is simple: should a hospital switch on an extra patient flow intervention before a forecast spike? The hospital data are real. The spike, the effect of the intervention and its cost are made up, because the point was to learn the method.
The model has four parts. A forecast for one week in one region, HSE Dublin and Midlands, with its spread of plausible values. A made up spike added to it. An assumed effect of the intervention, a cut of 15 of 100 in the growth above the current rate, with its own spread. And a penalty for acting, written on the same scale as the trolley rate. The rule is to pick the choice with the lower expected loss, where the loss is the trolley rate left over plus the penalty.
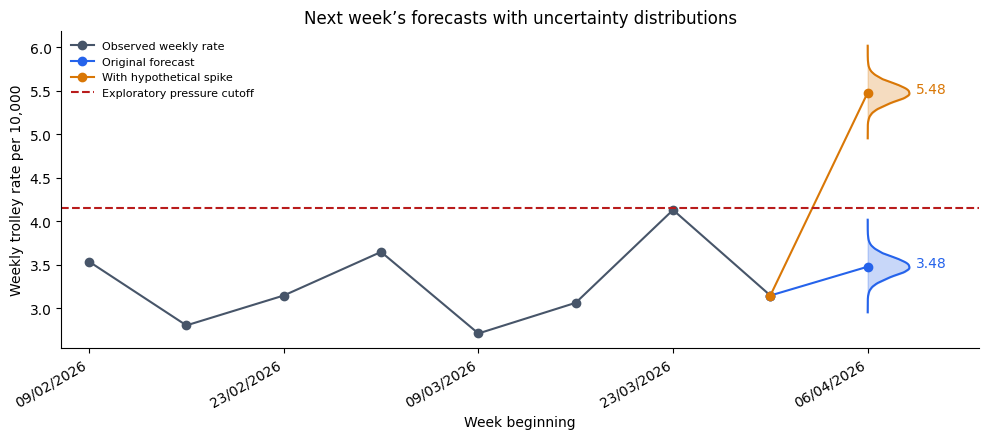
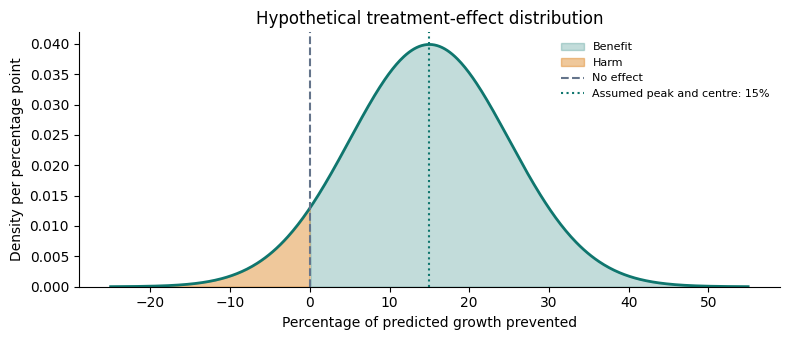
With the spike, the forecast was 5.48 trolleys per 10,000 residents, likely range 5.26 to 5.69. Intervening cut the expected loss from 5.48 to 5.15 after the penalty, and beat doing nothing in 92 of 100 scenarios drawn from the model. The most useful number was the break even penalty, 0.35 per 10,000: below that cost the model intervenes, above it the model does not. That turns "should we act" into "is acting cheaper than this", which someone who knows the hospital can answer.
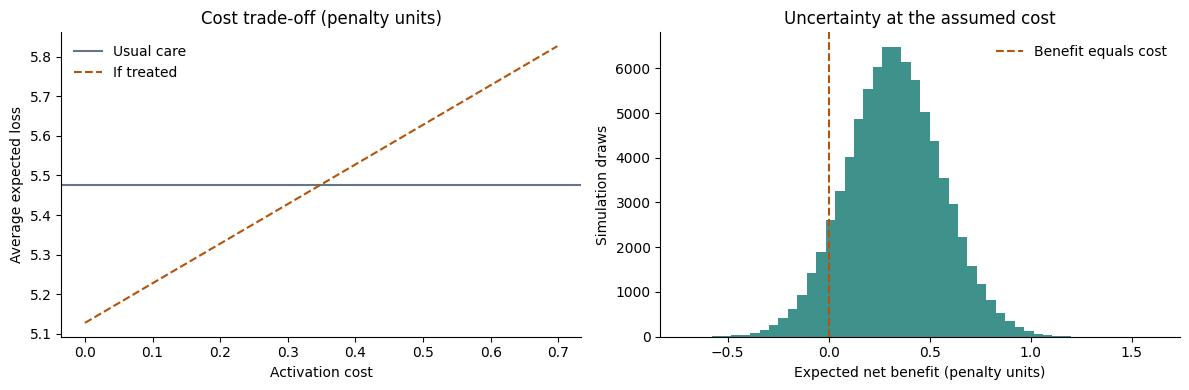
Changing one input at a time showed where the answer flips. A spike too small to cross the pressure cutoff means no intervention is considered. A zero average effect means doing nothing wins. A penalty of 0.40 means doing nothing wins. Doubling the spread of the effect kept the same average answer but cut the winning share from 92 of 100 to 76 of 100. The recommendation was never a property of the forecast. It was the forecast plus three assumptions, and the model let me change each one and see when the answer changed.
This is a learning exercise, not evidence that the intervention reduces crowding or saves money. The books were Smart Choices and Bayesian Decision Analysis. The executed notebook has every number.