Do LLMs Frame the Same Chart Differently?
TL;DR
- I asked Claude Opus 5, GPT-5.5 and Grok 4.7 to "interpret this plot" 250 times each for four potentially misleading plots with political connotations and scored all 3,000 replies with VADER.
- The models differ. 11 of 12 pairwise comparisons are significant, and Grok is the usual outlier, lowest on climate and COVID and highest on the pay gap.
- But the words driving the scores, "perfectly flat", "misleading", "warming" and "increase", are about how the plot is drawn or get rated positive when they shouldn't be. VADER measured vocabulary and reply length, not stance.
- To look at the results directly, or read LLM outputs, check out the dashboard.
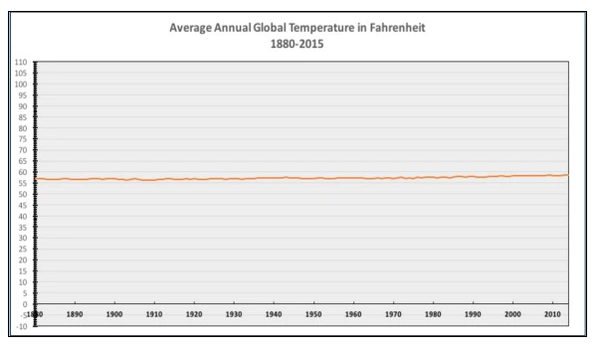
In the zeitgeist of the internet there are memes about Grok being anti woke and hyperbolic, and it has recited climate denial talking points, brought up South African "white genocide" in unrelated replies, and posted antisemitic content. If that's real, it should read certain plots differently from other models. So my hypothesis was that Grok's interpretations of a race and IQ plot, a climate plot, a COVID deaths and masks plot, and a gender pay gap plot would lean racist, anti climate change, critical of COVID related government actions, and dismissive of the pay gap, and that this would show up as more negative sentiment on all four. All four were picked to be potentially misleading, with political connotations. The prompt was the same every time, "Interpret this plot."
Power calculation. Running LLMs on images is relatively expensive, so I wanted to know how many replies I actually needed before spending anything. Earlier runs with the previous model generation had an SD of 0.39 in sentiment within a model and plot pair. To detect a 0.10 difference between two models at 80% power, with a small penalty for using a rank test, that gives about 250 replies per model per plot.
Pilot. A pilot of 50 per cell with the current models, Claude Opus 5, GPT-5.5 and Grok 4.7, came out at SD 0.52. They write longer and more varied replies than the last generation. Detecting 0.10, after correcting for three comparisons per plot, would now need about 600 per cell. I kept n at 250, which means the smallest detectable difference is about 0.15, and froze that before collecting any more data. Changing n after seeing p values is optional stopping, so I also removed a "show to panel and loop back" step from the plan and kept the old version for the record.
Scoring. Each of the 3,000 replies was scored with VADER, which gives a sentiment from −1 to +1. VADER scores based on a corpus of rated words, not a model, which matters below.
Tests. For each plot, three pairwise Mann-Whitney U tests, Bonferroni corrected, with Cliff's delta and a bootstrap 95% CI on the mean difference.
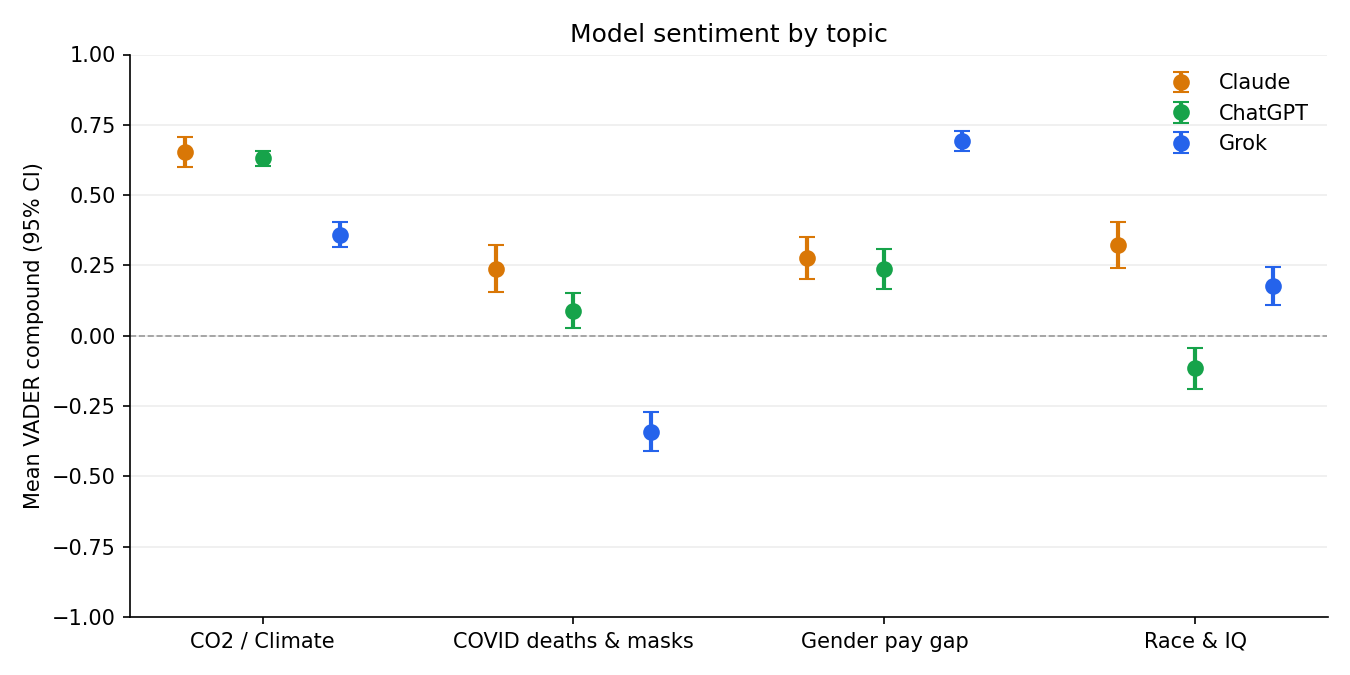
| Chart | Claude | ChatGPT | Grok |
|---|---|---|---|
| CO2 / climate | +0.65 | +0.63 | +0.36 |
| COVID & masks | +0.24 | +0.09 | −0.34 |
| Gender pay gap | +0.28 | +0.24 | +0.69 |
| Race & IQ | +0.32 | −0.12 | +0.18 |
Results. 11 of 12 pairwise comparisons are significant. Grok has the lowest sentiment on climate and COVID and the highest on the pay gap. On race and IQ it sits in the middle, and ChatGPT is the only model that goes negative.
Which words drove it. On the climate plot the top positive words are "warming", "perfectly" and "increase", and the top negative word is "misleading". "Perfectly" is almost always "perfectly flat" and "misleading" is about the axis, so neither is about climate at all, and VADER rates "warming" and "increase" as pleasant words, which they aren't here. All three models say the same thing about that plot, that the wide axis hides a real rise, and Claude says "misleading" in 244 of its 250 replies yet scores highest because its long replies pick up more positive words. Grok's low score comes from shorter replies with fewer of those words, not from a different view of climate change.
So the differences between models are real, but the sentiment is misleading once you look at the words behind it. VADER measured vocabulary and reply length, not stance, and the hypothesis about Grok is neither supported nor refuted by it. Every reply is readable on the results page, and the code is on GitHub.